
เป็น program upskill AI ของพนักงาน จุดประสงค์หลังจบ program จะแบ่งเป็น 4 Personas
- Process optimizer
- Data and Report automation
- Product designer
- Full stack – solution delivery
Day 1 เรียน 6 sections แต่มีเรื่อง data model น่าสนใจ งั้น recap ไว้หน่อย เสริมหน่อย อาจารย์เนยสอนสนุกมากกกก
- Section 1 : Data driven organization and AI
- Section 2 : Data Foundation and data modeling
- Section 3 : Statistical thinking and EDA
- Section 4 : Tidy data
- Section 5 : Cleaning data
- Section 6 : Feature engineering and relation between features
Outline and short note
Section 1 : Data driven organization and AI
อาจารย์ overview บริษัทที่ใช้ Data driven, Business cases เช่น up-sell (ขายของ 1 ชิ้นในราคาสูงขึ้น) เช่น iPhone 17 + pro ได้รายได้สูงกว่า iphone 17 เฉยๆ. cross-sell ขายหลายชิ้น เช่น หนังสือ A + B ในหมวดหมู่เดียวกันหรือนักเขียนคนเดียวกัน. คำถาม iPad + Apple pencil เป็น up หรือ cross sell ?
ตัวอย่างแต่ละ Sector ใช้ข้อมูลทำอะไรบ้าง
Bank
ใช้ credit score, risk management.
Production and manufacturing
ใช้ planning, forecast demand, transportation allocation.
Insurance
ใช้ consumer profiling, sentiment analysis
Retail and commercial
ใช้ geo-marketing, supply chain.
เวลาเจอ business objectives จะตอบได้จาก stage of data analytics.
- Desscriptive
- Diagnostic
- Predictive
- Prescriptive
ถ้าจะ Action business case (top pyramid) ได้ ต้องหา insight ให้เจอจาก data (base pyramid) // information // insight
แตะประเภทของ AI นิดหน่อย มี 2 แบบ
- Analytical AI eg. segment, sales forecast
- Generative AI eg. design concept, code generate, summarise data.
Section 2 : Data Foundation and data modeling
Relationship in data schema ตารางตรงกลางเรียก “Fact” รอบๆดาวเรียก “Dimension”
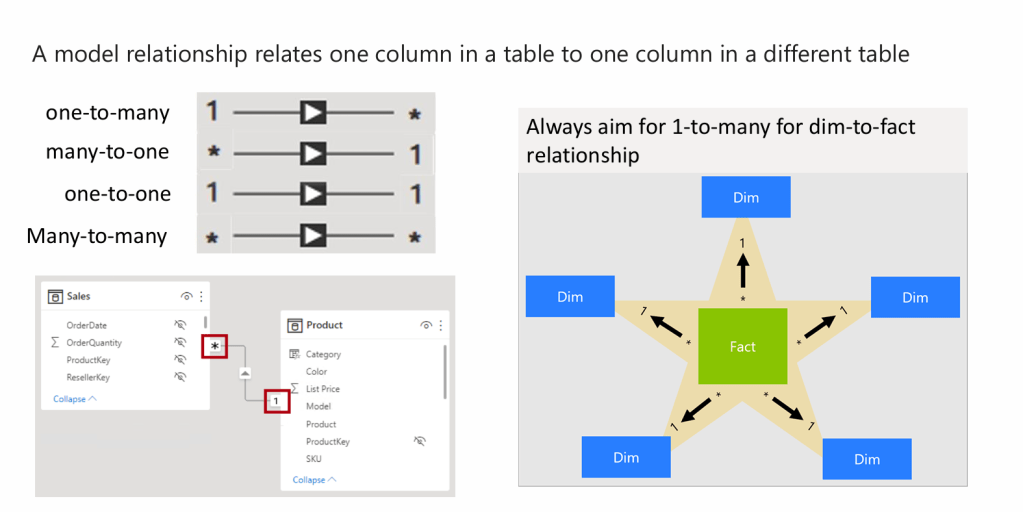
แต่ละ table จะมี primary key เป็น unqinue และใน fact table จะมี foreign key ใช้เป็น primary key ใน dimension table ตัวอย่าง FK ใน column “customer_id” ใน fact table “Orders” จะเป็น PK ของ dimension table “Customers”
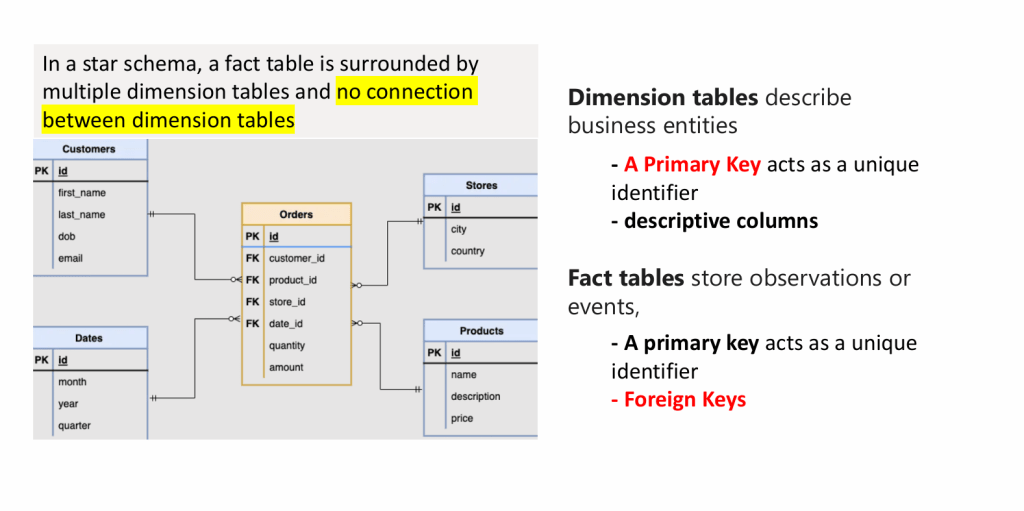
ตัวอย่างเพิ่มเติม
Section 3 : Statistical thinking and EDA
EDA คือ Exploratory data analysis 3 keys aspect
- understanding data features
- cleaning data
- identifying data patterns ans relationship
อาจารย์บอกว่า EDA เป็น art & science ไม่มี standard อ้าวววว แต่มี tips and trick ให้ 2 ข้อ
- start with question : ช่วย scope down and focus ด้วยข้อมูล เป็นขั้นตอนที่สำคัญก่อนทำ EDA
- start from big picture : ถามคำถามง่ายๆแล้วค่อย drill down
Section 4 : Tidy data
คือการทำให้ข้อมูลเป็นระเบียบ เน้นที่ตัว raw data บางทีขอ้มูลมาในรูปแบบ report เหมือนที่เรา pivot มาแล้ว
3 rules of tidy data
- each variable / feature is a column
- each observation is a row
- every cell is a single value
ตัวอย่าง untidy data format
Section 5 : Cleaning data
ทั่วๆไป dirty data มี 6 แบบ
- outlier :
- missing :
- inconsistent : Bangkok, BKK, bkk, กรุงเทพ
- duplicate :
- wrong type : classic case คือ มอง date เป็น number
- inaccurate : เป็นค่า error เช่น body temperature sensor reading 30 degress celsius เป็นไปไม่ด้ายยยย
Section 6 : Feature engineering and relation between features
part นี้ เจ๋งดี เสียดายไม่ได้ลงรายละเอียดมากนัก เป็นการเอาข้อมูลมาสร้าง feature ใหม่ คนทำส่วนนี้ได้ต้องมี domain expert ด้วย
- convert distance and duration data of flights into velocity.
- extract transection data into customer behavior data.
หาความสัมพันธ์ของข้อมูลอาจจะใช้ correlation.

Leave a comment